Over the past six months, I've pretty much completed the transition from Grace to Veusz, as my primary graphing software, for journal-quality plots.
2. Choose a scatter plot, and plot one of the datasets (here x v/s z).
3. Add another graph by clicking the graph icon.
4. You can right-click on "graph1" and choose to "hide" or "show" it. Let's hide it for now.
5. With graph1 out of the way, resize, move, and adjust graph2.
6. "Show" graph1 by right-clicking. Notice that graph2 might be under graph1 and hence invisible. Right click on graph2 and move it up or down.
As I have grown familiar with the software, I've come to realize that it is powerful, has much better documentation and support on the web (which is somewhat surprising since Veusz is just as specialized, and much newer).
Anyway, thanks to Google Analytics, I know that this post on "how to create inset plots or subplots with Grace" is quite popular. I thought I ought do a short-series where I repeat how to do the same common stuff with Veusz.
Here is the first installation. It discusses how to do inset plots.
Really, it is a cinch!
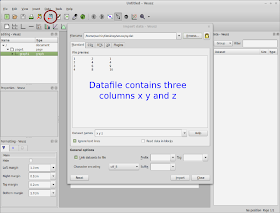
1. Load in the appropriate datafile. Here my datafile has three columns. Click on the images if you want to see a larger version.
2. Choose a scatter plot, and plot one of the datasets (here x v/s z).
3. Add another graph by clicking the graph icon.
4. You can right-click on "graph1" and choose to "hide" or "show" it. Let's hide it for now.
5. With graph1 out of the way, resize, move, and adjust graph2.
6. "Show" graph1 by right-clicking. Notice that graph2 might be under graph1 and hence invisible. Right click on graph2 and move it up or down.
7. That's it. You can now go in and decorate the two graphs to your heart's content.


No comments:
Post a Comment